Debugging Terraform providers with VS Code
May 28, 2024
My first experience of ‘debugging’ was using good old console.log in JavaScript when I was first learning about programming. Since then I’ve learned that print statements and logs only get you so far, and proper debugging is so much more useful. When I first started contributing to Terraform provider projects I wasn’t shown how to use debuggers with providers and the resources I found online were a bit fragmented. So, this blog is a way for me to share what I learned and hopefully help others (or just be a reference for myself in the future!).
What’s a Terraform provider?
This blog won’t cover what Terraform and Terraform providers are at great length. There are much better resources out on the internet to explain them. Having said that, here’s a short summary: In a nutshell, Terraform is an Infrastructure as Code (IaC) tool that lets users write declarative configuration code that is used to create resources in the ‘real world’. Terraform achieves this by interacting with APIs, for example AWS’s APIs to create an EC2 instance, or GitHub’s API to create a new team in a GitHub origanization. Terraform itself doesn’t interact with APIs. Instead, Terraform instructs Terraform provider plugins to do the job of creating, reading, updating or deleting the given resource and report back with data about the resource once it’s done.
Why is a debugger needed?
In a perfect world providers would be a simple adapter that maps data from API entities to the data structure describing the resource in Terraform. However often APIs aren’t designed in a way that works well with Terrform, for example: a mixture of declarative and imperative endpoints to manage one entity type, split control of a field’s value between client and server, API entities that are split into multiple entities in Terraform to enable more fine-grained control, etc. Depending on the situation you might need to write more complex code than usual, which begins to make using a debugger more appealing. Add on considerations of how that code should behave when a resource is updated versus created, or updated given a prior state, then a debugger begins looking reeeeally appealing.
Setup
To debug providers using VS Code you’ll need to install the Go extension for VS Code. This extension will provide a way to debug Go code using the VS Code UI, such as creating and navigating through breakpoints. The extension requires a few dependencies to be installed, including Delve, but VS Code should guide you through installing dependencies on your first try at debugging Go code.
Once the extension is set up, open the run and debug menu in the side bar and you should see this prompt to configure the debugger tools by creating a launch configuration code at .vscode/launch.json.
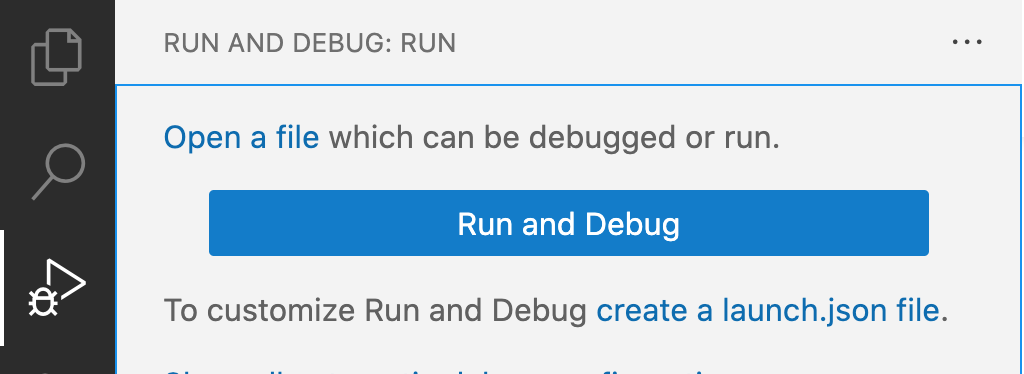
Create an empty file at .vscode/launch.json. The next sections will describe what configurations to include in that file and how to use them.
Finally, create a .vscode/private.env file and add details about environment variables that are required for running the acceptance tests and configuring the provider:
# Define each value on separate lines
KEY=value
USERNAME=user
PASSWORD=password
Make sure your repo has the .vscode/ folder gitignored; these values should not be committed to version control.
Now we’re ready to get started!
Debugging providers during acceptance tests
The best approach when adding a new feature to or investigating a bug in a Terraform provider is to create an acceptance test that initially fails, following TDD. Then you work to add the feature or fix the bug so that the test passes.
The testing framework for providers uses a local Terraform binary and performs real plan, apply (etc.) actions using the provider code present in your repo. As a result, you can add breakpoints and then launch a test in debug mode to see how data flows through your new code.
First, paste this into the file (or append the configuration object if you already have a lauch.json file):
{
    "version" : "0.2.0",
    "configurations" : [
        {
            // Debug acceptance tests
            "name": "Debug Selected Acceptance Test",
            "request" : "launch",
            "type" : "go",
            "args" : [
                "-test.v",
                "-test.run",
                "^${selectedText}$"
            ],
            "mode" : "auto",
            "program" : "${fileDirname}",
            "envFile" : "${workspaceFolder}/.vscode/private.env",
            "showLog" : true
        }
    ]
}
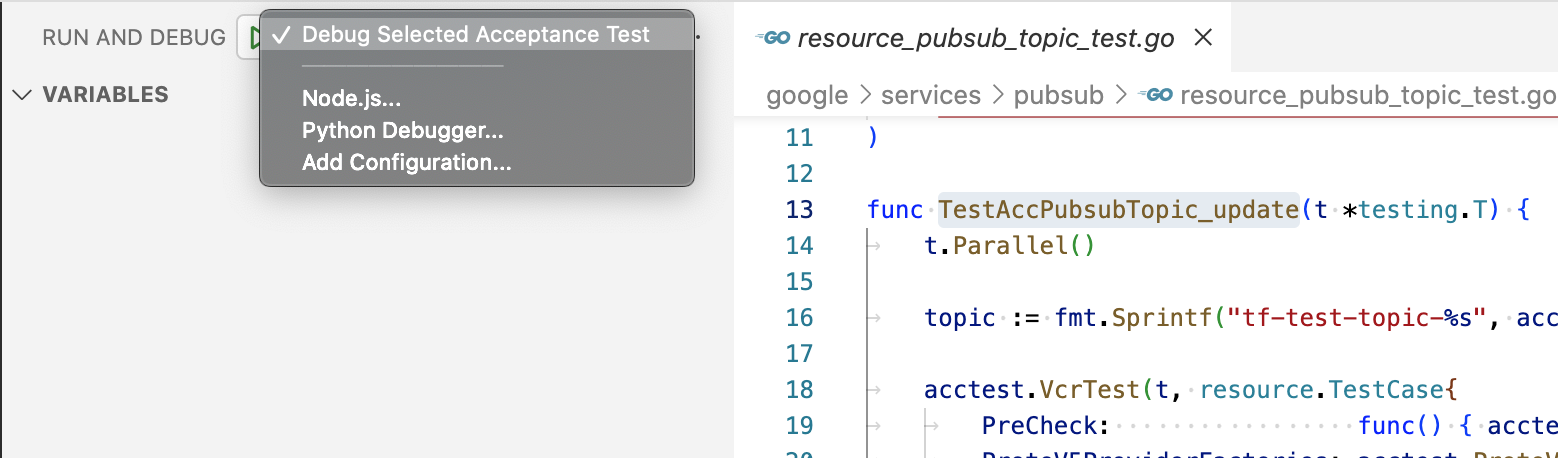
To use this debug configuration, navigate to an acceptance test in the code base and select the text of test’s name with your cursor. Then, open the run & debug menu (click View > Run in the menu bar). Make sure that the dropdown menu has the “Debug Selected Acceptance Test” configuration selected, and then click the green arrow to start the test!
This configuration builds a test binary and then runs a command like this, using the selected text to narrow down which test is run:
./test-binary -test.v -test.run ^<selectedText value here>$
For information on how to create breakpoints in VS Code and start properly using the debugger, see the official VS Code debugging documentation.
Debugging providers during manual tests
Sometimes manual testing might be unavoidable, or maybe you’ve reproduced a bug with some HCL files and want to dive into investigation before committing to writing a whole test! In that case you can launch a provider server in debug mode on your laptop, and then pass an environment variable into Terraform commands that allow use of that pre-launched provider server. Bear in mind that debug mode is a feature that provider developers need to explicitly implement in a provider’s code, so might not be available for all provider projects out there.
First, open your .vscode/launch.json file and paste in the following JSON (or append the configuration object if you already have a lauch.json file):
{
    "version": "0.2.0",
    "configurations": [
        {
            // Run provider in debug mode
            "name": "Start Provider in Debug Mode",
            "request": "launch",
            "type": "go",
            "mode": "debug",
            "args": [
                "-debug"
            ],
            "program": "${workspaceFolder}",
            "envFile": "${workspaceFolder}/.vscode/private.env",
            "showLog": true
        }
    ]
}
Open the run & debug menu (click View > Run in the menu bar), select “Start Provider in Debug Mode” from the dropdown of available debugger configurations, and press the green arrow to start.
Open the debug console tab (View > Debug Console in the menu bar) to see the output from the process that started. Eventually you should see a message like this in the logs:
Provider started. To attach Terraform CLI, set the TF_REATTACH_PROVIDERS environment variable with the following:

	TF_REATTACH_PROVIDERS='{"registry.terraform.io/hashicorp/google":{"Protocol":"grpc","ProtocolVersion":5,"Pid":48952,"Test":true,"Addr":{"Network":"unix","String":"/var/folders/tf/m6_pn85n7mxdttnfbgycrk5r0000gn/T/plugin1673856406"}}}'
You can then navigate to where your HCL files are, set that environment variable in your termainl, and then proceed to run Terraform commands using your lauched provider! Again, don’t forget that you will need to create breakpoints in the VS Code UI to actually begin debugging.
Conclusion
The two snippets of JSON above should help you get started debugging a provider while running either an acceptance test or terraform CLI commands. There’s also the option of using the Delve CLI directly if you want to use Delve features that aren’t supported in the VS Code UI, but I’ve not felt limited by using the UI.
Happy debugging!